1️⃣ Google My Business (GMB) Insights
Metrics
| Metric | Value (Mar 2025) | Change vs. Mar 2024 |
|---|---|---|
| Total Profile Views | 7,648 | +492.4% |
| Total Searches | 5,394 | +556.2% |
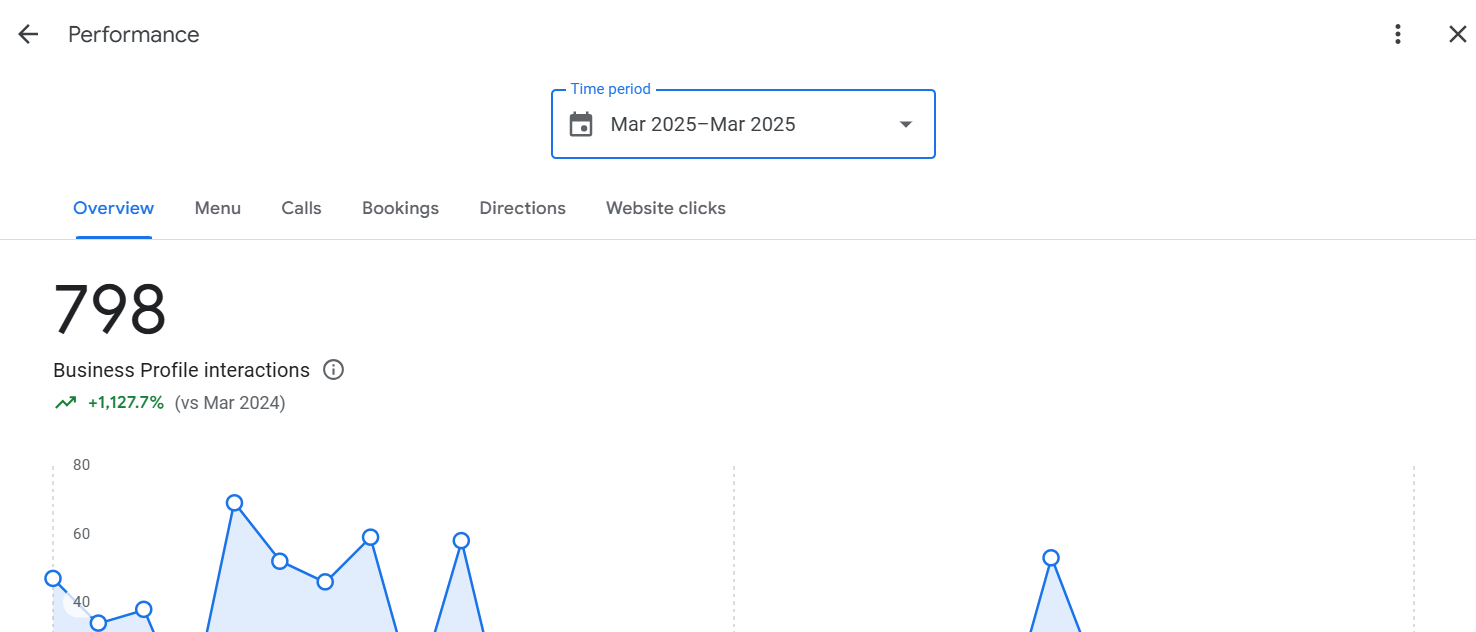
| Total Business Interactions | 798 | +1,127.7% |
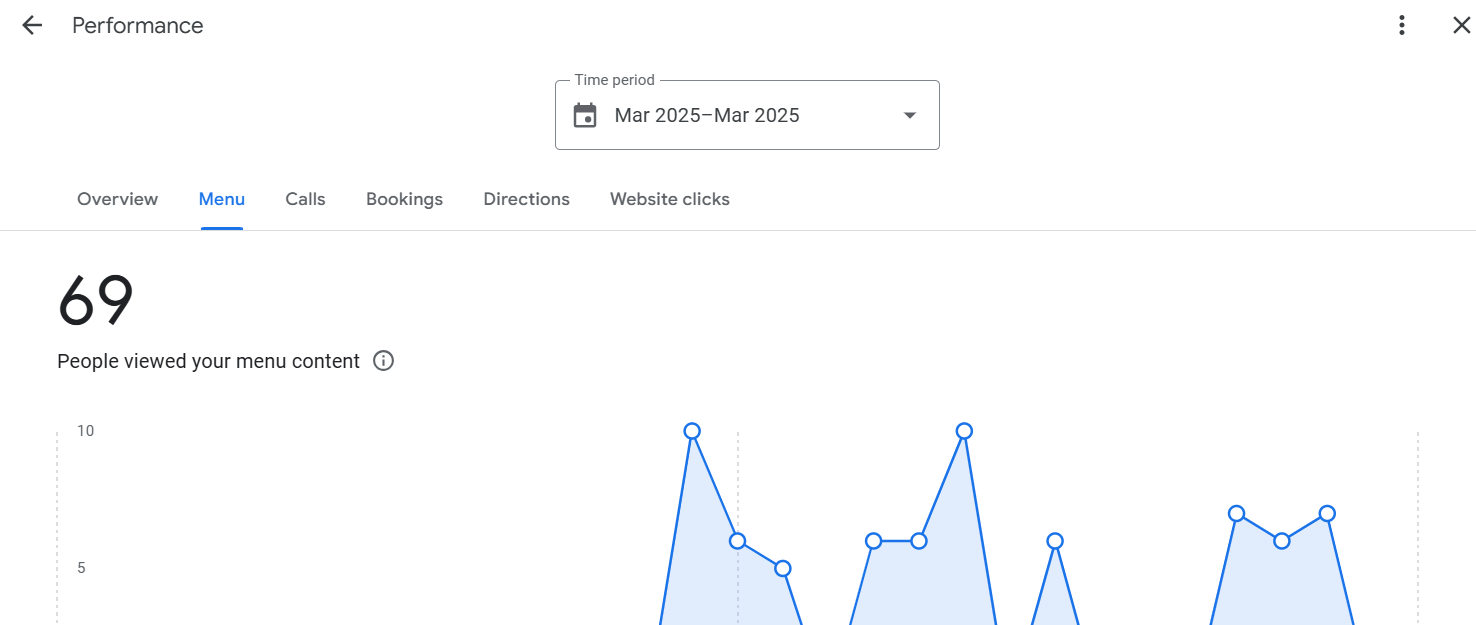
| Menu Views | 69 | Not provided |
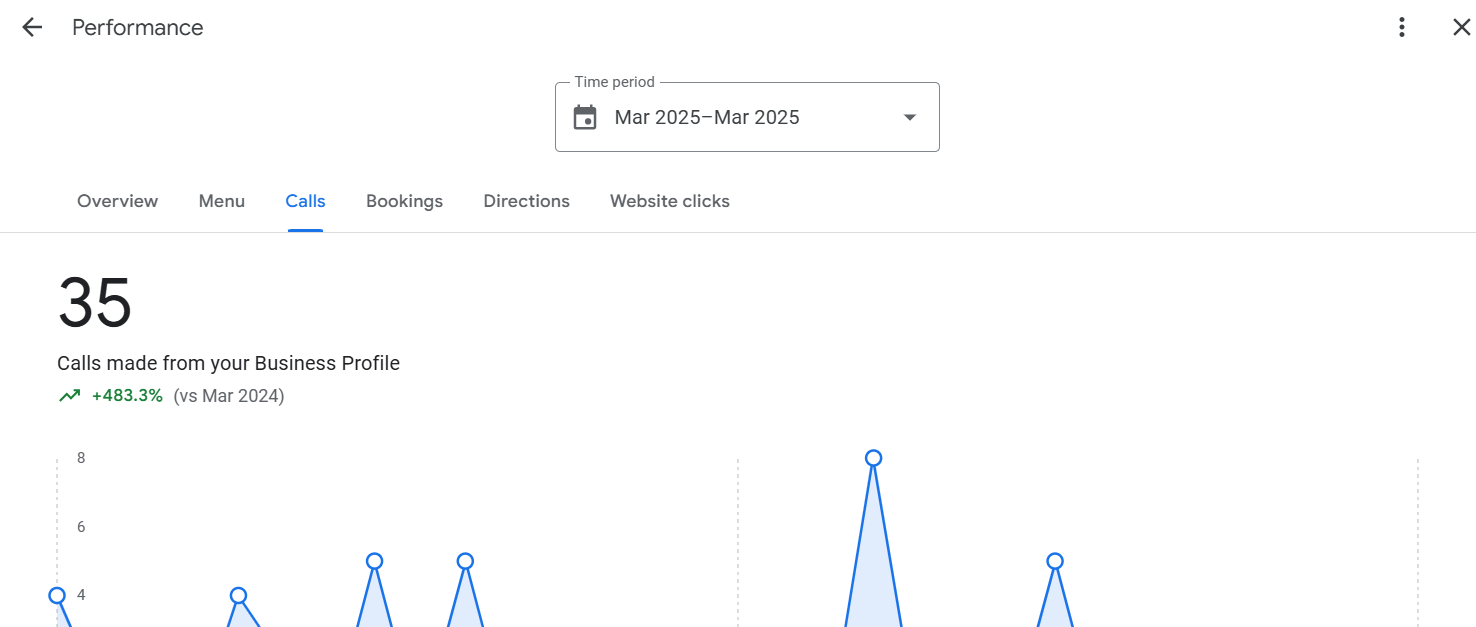
| Calls from GMB | 35 | +483.3% |
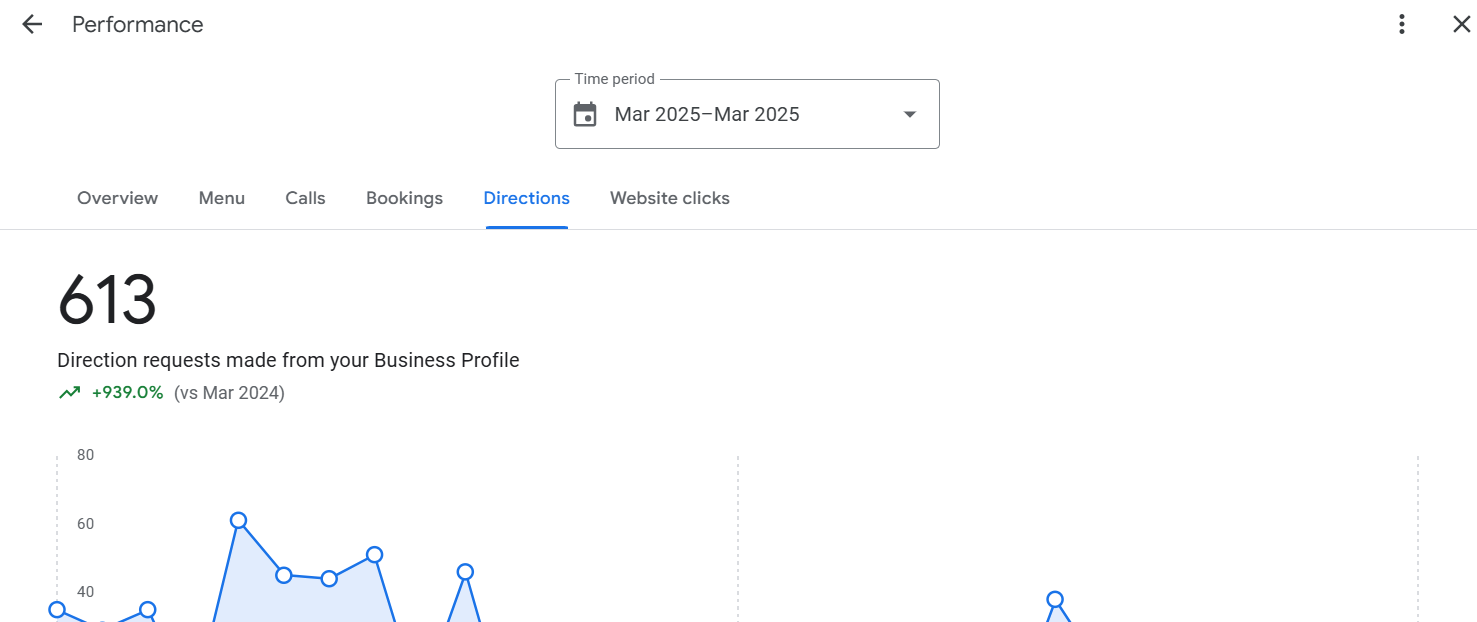
| Direction Requests | 613 | +939.0% |
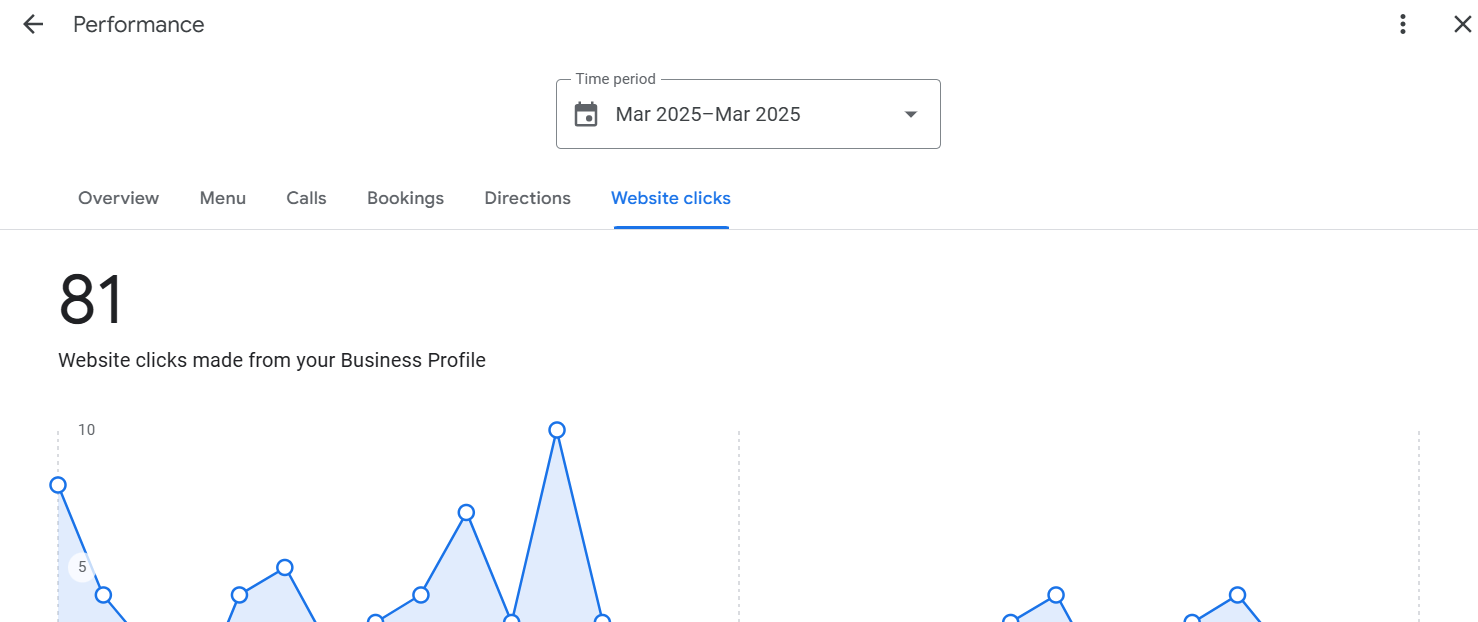
| Website Clicks | 81 | Not provided |
Platform and Device Breakdown
Google Maps – mobile: 6,869 (90%) | Google Search – mobile: 627 (8%) | Google Maps – desktop: 78 (1%) | Google Search – desktop: 74 (1%)
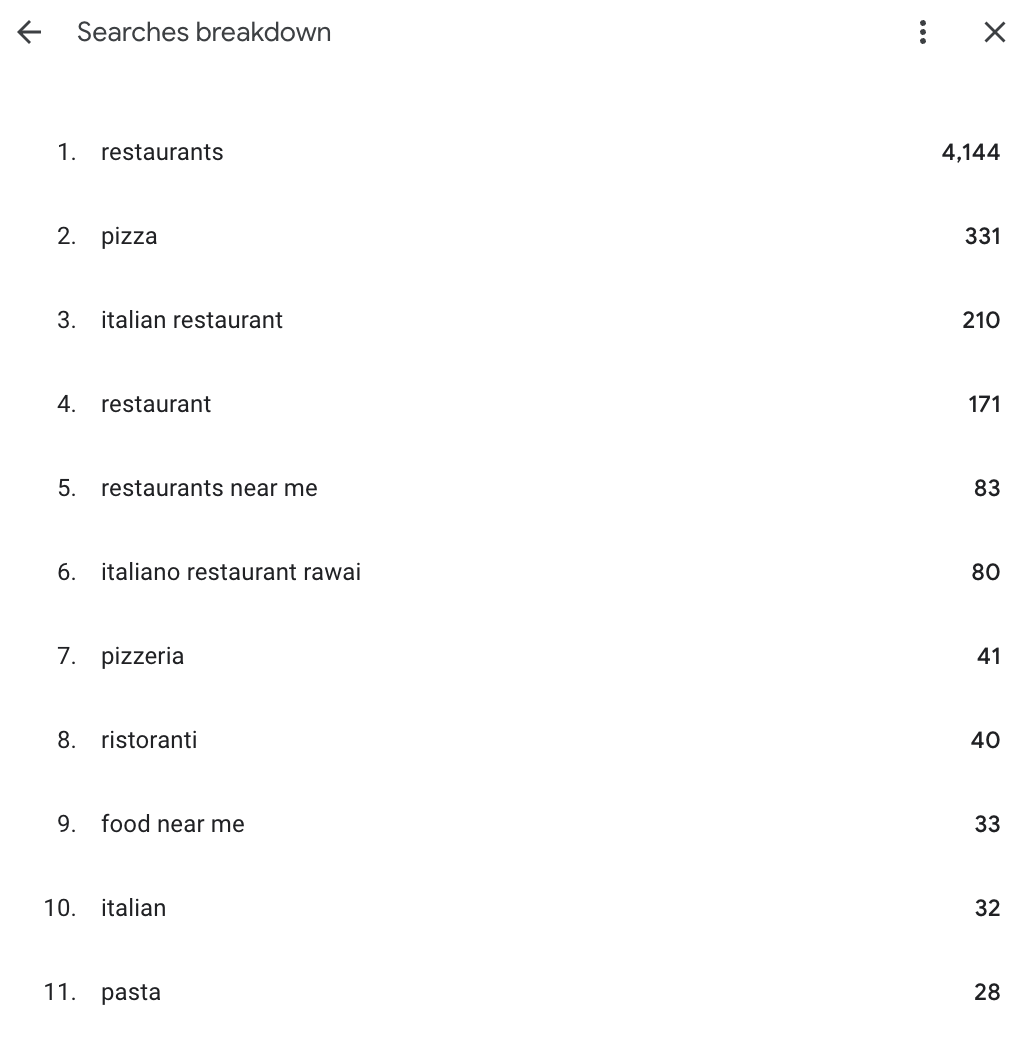
Top Search Queries
| Rank | Search Term | Impressions |
|---|---|---|
| 1 | restaurants | 4,144 |
| 2 | pizza | 331 |
| 3 | italian restaurant | 210 |
| 4 | restaurant | 171 |
| 5 | restaurants near me | 83 |
| 6 | italiano restaurant rawai | 80 |
| 7 | pizzeria | 41 |
| 8 | ristoranti | 40 |
| 9 | food near me | 33 |
| 10 | italian | 32 |
| 11 | pasta | 28 |
Visual Insights
Total Business Interactions (798): Significant growth in user engagement.
Menu Views (69): A sharp increase, but still relatively low.
Calls from GMB (35): Strong growth, indicating improved customer intent.
Direction Requests (613): High demand for location-based actions.
Website Clicks (81): Steady growth in website traffic from GMB.
How People Discovered You: 90% of views came via Google Maps on mobile.
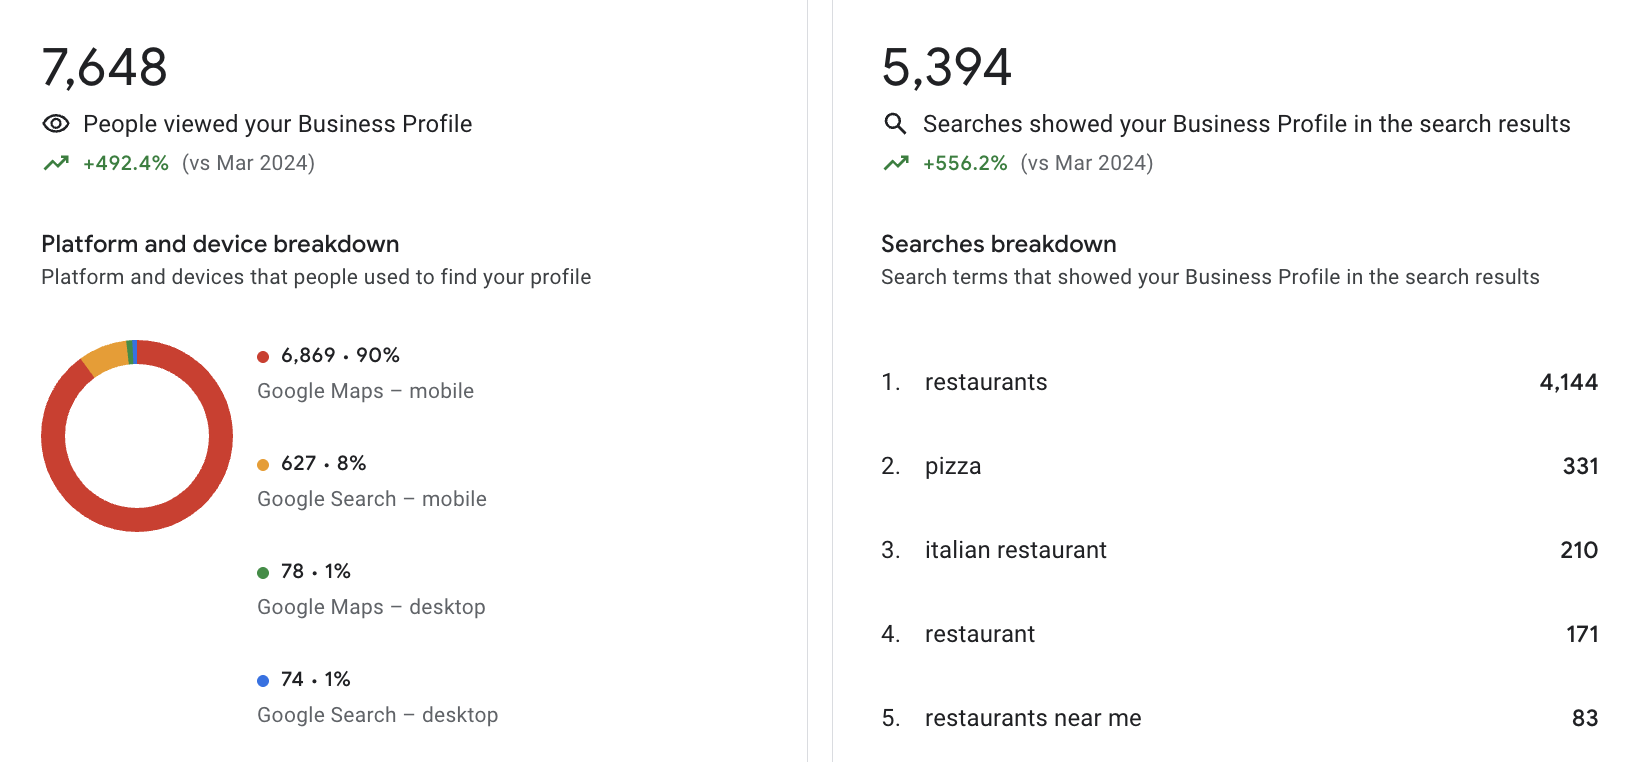
Searches Breakdown: Top search terms include 'restaurants' (4,144 impressions) and 'pizza' (331 impressions).
GMB Summary
Visibility: Total Profile Views reached 7,648 (+492.4% vs. Mar 2024), and Total Searches hit 5,394 (+556.2% vs. Mar 2024), indicating a massive increase in discoverability.
User Behavior: Direction Requests (613, +939.0%) remain the dominant action, reflecting strong local intent. Calls (35, +483.3%) and Website Clicks (81) show improved conversion potential, while Total Business Interactions (798, +1,127.7%) highlight robust engagement.
Menu Engagement: Menu Views are at 69, which is low relative to overall interactions (less than 9% of interactions), suggesting underutilization of the menu feature.
Platform Trends: 90% of views (6,869) came via Google Maps on mobile, with only 1% each from desktop (Maps: 78, Search: 74), emphasizing the importance of mobile optimization.
Search Trends: Generic terms like “restaurants” (4,144 impressions) and “pizza” (331 impressions) dominate, but branded searches like “italiano restaurant rawai” (80 impressions) are growing, showing increased brand recognition.
Conversion Gaps: Calls and Website Clicks are a small fraction of total interactions (4.4% and 10.2%, respectively), indicating room to drive more direct actions.
GMB Action Steps
- Add a 360° virtual tour of the restaurant to enhance profile appeal, especially for mobile users (90% of views).
- Post weekly GMB updates with seasonal menus or events (e.g., “Spring Pizza Special”) to sustain engagement.
- Optimize for voice search by including phrases like “restaurants near me” and “italian restaurant” in the GMB description, targeting top search terms.
- Implement a review campaign via QR codes on receipts to boost ratings and visibility, leveraging the 7,648 profile views.
- Highlight signature dishes with high-quality images in the menu section to drive views beyond 69.
- Test GMB’s “Book a Table” feature to convert direction requests (613) into reservations.
- Investigate the significant year-over-year increases (e.g., +1,127.7% interactions) to identify successful strategies and ensure data accuracy.
3️⃣ Website & Reservation System
Website Analytics (Last 28 Days)
| Metric | Value | Change vs. Previous 28 Days |
|---|---|---|
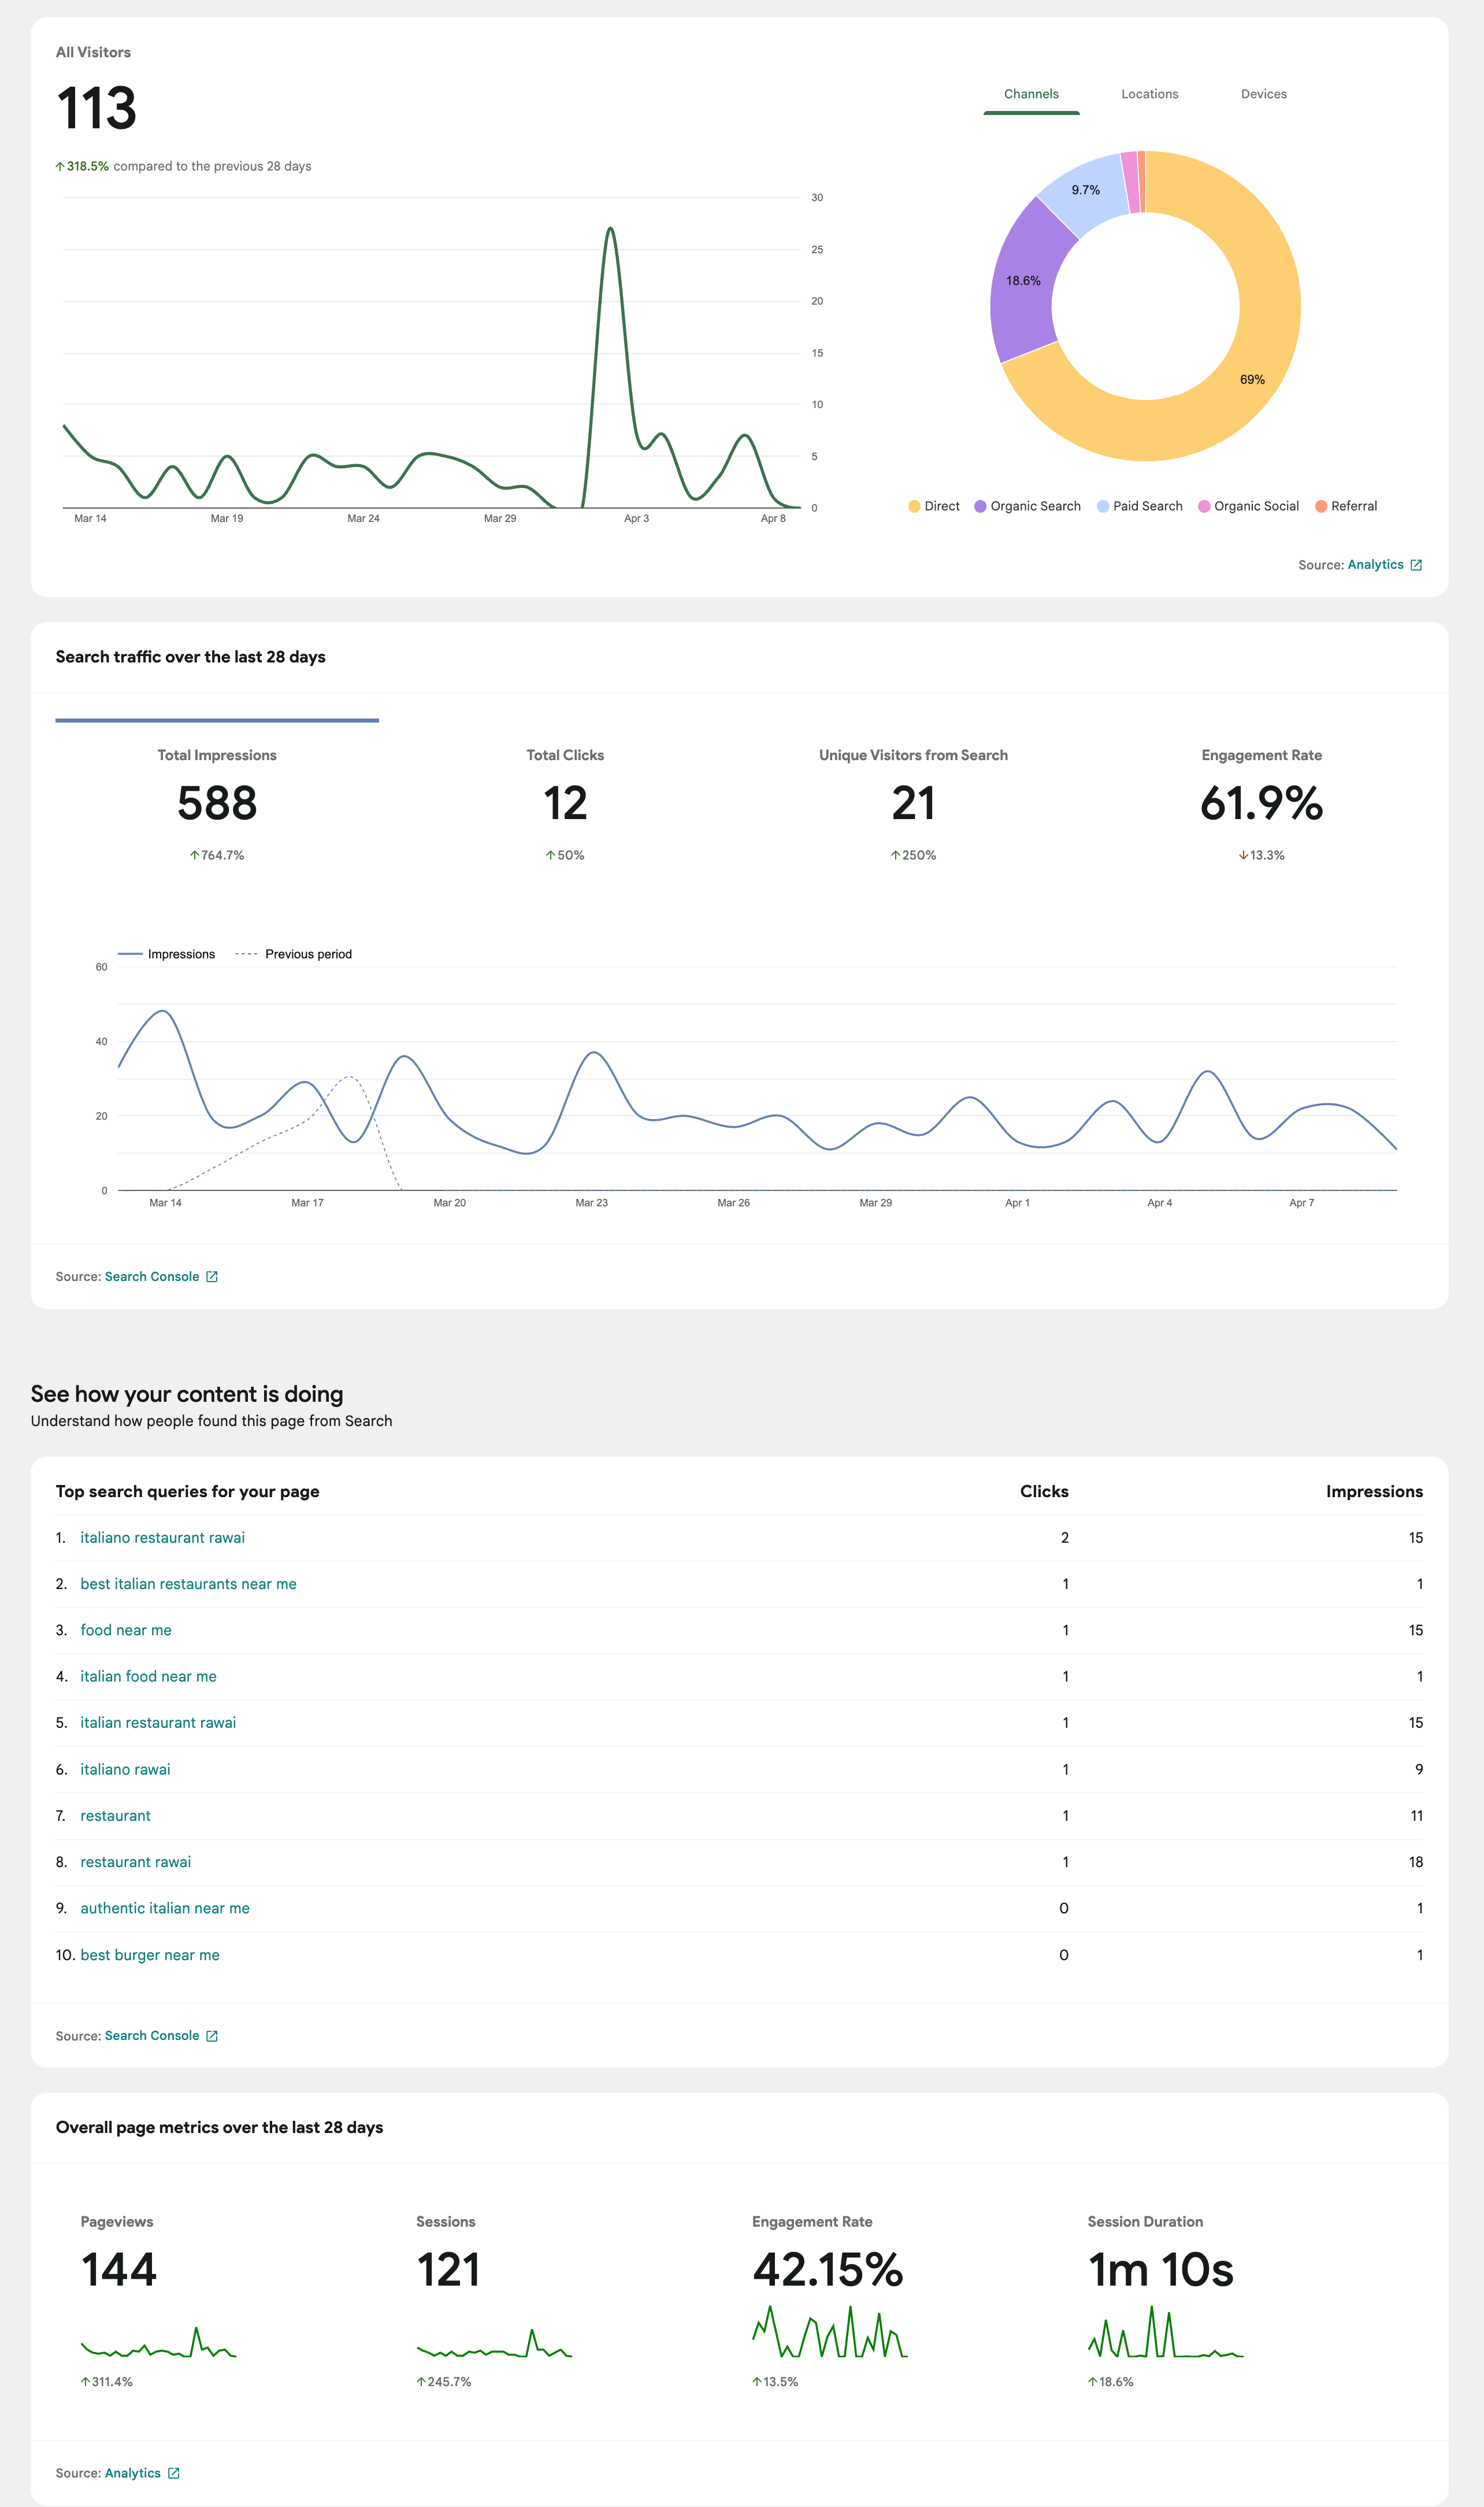
| Total Visitors | 113 | +31.5% |
| Total Impressions | 588 | +74.6% |
| Total Clicks | 12 | +50.0% |
| Unique Visitors from Search | 21 | +250% |
| Engagement Rate (Search) | 61.9% | +31.3% |
| Pageviews | 144 | +31.1% |
| Sessions | 121 | +245.7% |
| Engagement Rate (Overall) | 42.1% | +13.0% |
| Average Session Duration | 1m 10s | +18.6% |
Traffic Sources
Direct: 69.6% | Organic Search: 18.8% | Paid Search: 8.7% | Organic Social: 2.9%
Top Search Queries
| Rank | Search Query | Clicks | Impressions |
|---|---|---|---|
| 1 | italiano restaurant rawai | 2 | 15 |
| 2 | best italian restaurants near me | 1 | 1 |
| 3 | food near me | 1 | 15 |
| 4 | italian food near me | 1 | 15 |
| 5 | italiano rawai | 1 | 9 |
Visual Insights
Website Performance Trends: Traffic spiked around April 2, with steady impressions and engagement.
Website & Reservation System Summary
Traffic Growth: Total Visitors increased by 31.5% to 113, with Sessions surging by 245.7% to 121, indicating a significant uptick in website activity.
Search Performance: Impressions grew by 74.6% to 588, and Clicks rose by 50.0% to 12. Unique Visitors from Search jumped by 250% to 21, showing improved SEO visibility.
Engagement: The overall Engagement Rate is 42.1% (+13.0%), and the Search Engagement Rate is 61.9% (+31.3%), reflecting strong user interest. Average Session Duration increased by 18.6% to 1m 10s, suggesting users are spending more time exploring the site.
Traffic Sources: Direct traffic dominates at 69.6%, likely driven by GMB and social media links (e.g., 339 Link Clicks from Meta). Organic Search (18.8%) and Paid Search (8.7%) contribute modestly, while Organic Social (2.9%) is low, aligning with the 1% organic reach on Meta platforms.
Search Queries: Branded terms like “italiano restaurant rawai” (2 clicks, 15 impressions) lead, but generic queries like “food near me” and “italian food near me” (15 impressions each) show high potential for capturing broader audiences.
Reservation System: No specific data on reservation form completions is available, but the old report noted a seamless system with automated notifications. The increase in sessions and engagement suggests the reservation process is likely contributing to user activity.
Areas for Improvement: Organic Social traffic (2.9%) is minimal, and the click-through rate (CTR) from search (12 clicks from 588 impressions, ~2%) is low, indicating a need for better SEO optimization and meta descriptions.
Website Action Steps
- Optimize meta titles and descriptions for high-impression queries like “food near me” and “italian food near me” to improve CTR beyond 2%.
- Implement lazy loading for images to maintain or improve session duration (1m 10s) as traffic grows.
- Add a chatbot for instant reservation assistance and FAQs to convert more of the 121 sessions into bookings.
- Track user behavior with heatmaps to optimize navigation and reduce bounce rates on key pages (e.g., menu, reservation form).
- A/B test reservation form designs to increase completions, especially with the 61.9% search engagement rate.
- Integrate Google Tag Manager to track reservation form submissions and other conversions.
- Boost Organic Social traffic (currently 2.9%) by linking to the website in Meta posts and Stories, leveraging the 339 Link Clicks from Meta.
4️⃣ Ads Performance Insights (Meta & Google Ads)
Meta Ads Metrics (March 2025)
| Metric | Value | Change vs. Previous Period |
|---|---|---|
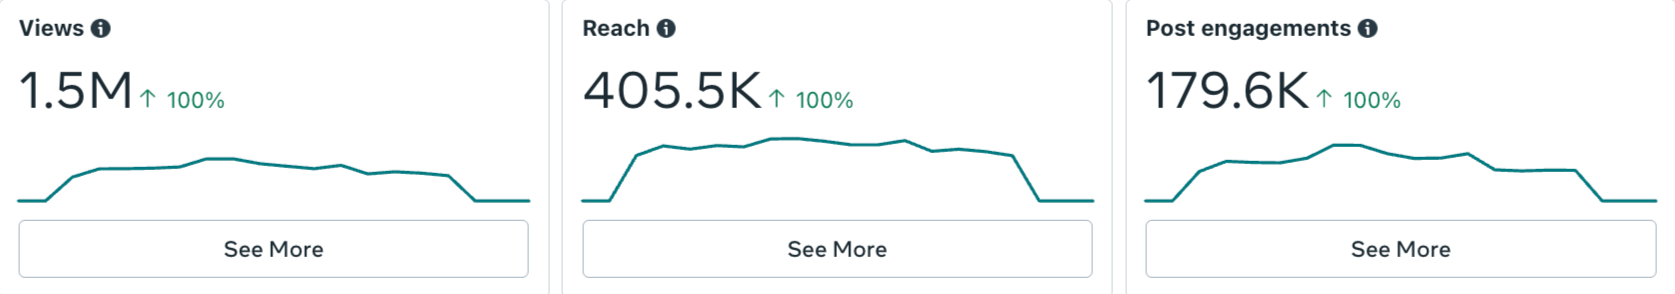
| Views | 1.5M | +100% |
| Reach | 405.5K | +100% |
| Post Engagements | 179.6K | +100% |
| Link Clicks | 443 | Not provided |
| Amount Spent | ฿12,127.53 | Not provided |
Meta Ads Campaign Breakdown
| Ad Type | Date | Views | Reach | Link Clicks | Amount Spent | Budget | Status |
|---|---|---|---|---|---|---|---|
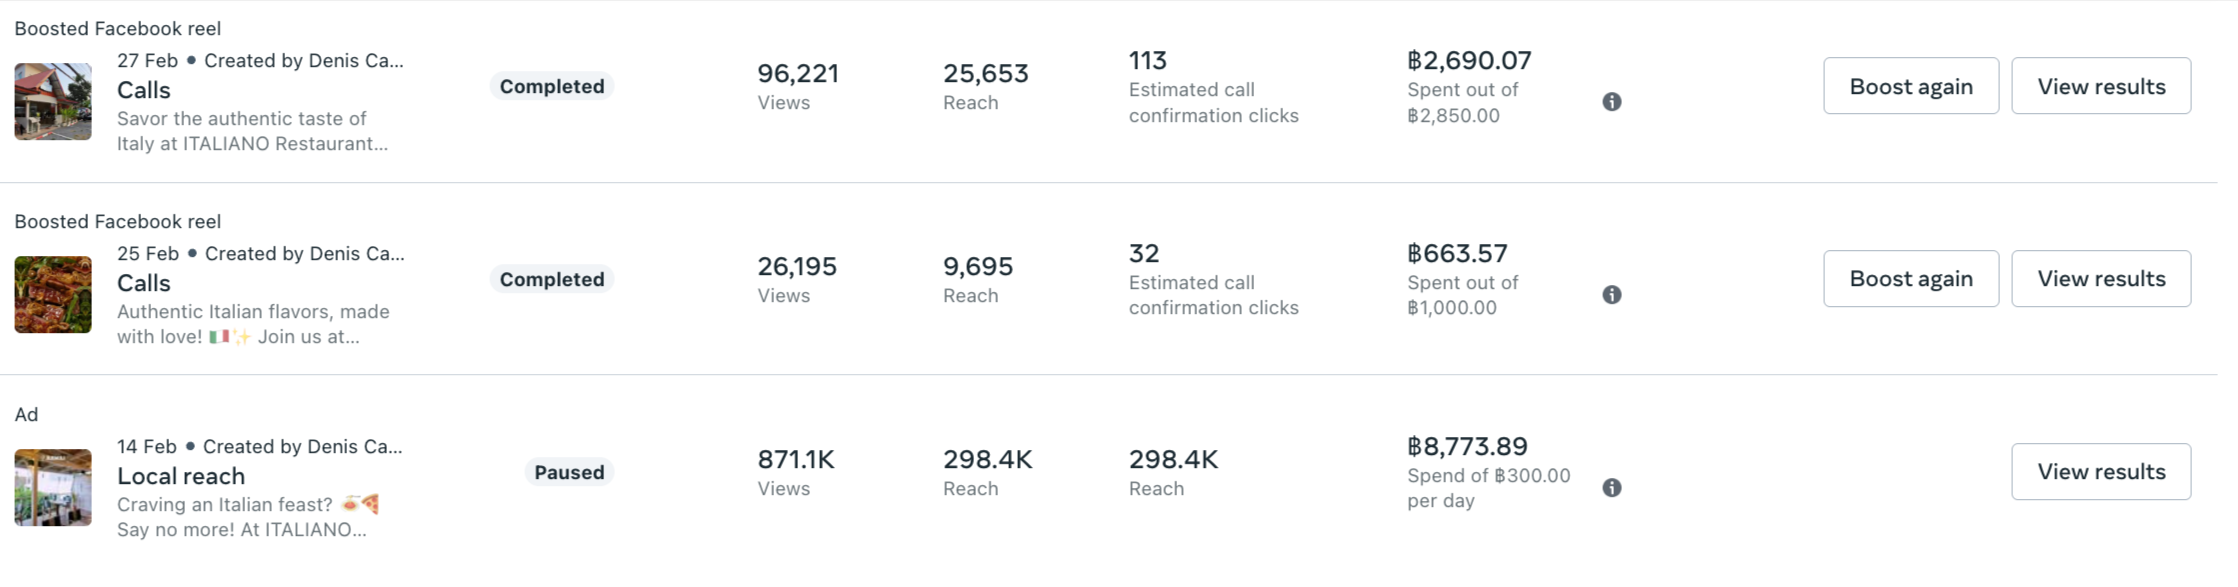
| Boosted Facebook Reel | 27 Feb | 96,221 | 25,653 | 113 | ฿2,690.07 | ฿2,850.00 | Completed |
| Boosted Facebook Reel | 25 Feb | 26,195 | 9,695 | 32 | ฿663.57 | ฿1,000.00 | Completed |
| Ad (Local Reach) | 14 Feb | 871.1K | 298.4K | 298 | ฿8,773.89 | ฿300.00/day | Paused |
Google Ads Metrics (Last Month, ~March 2025)
| Metric | Value | Change vs. Previous Period |
|---|---|---|
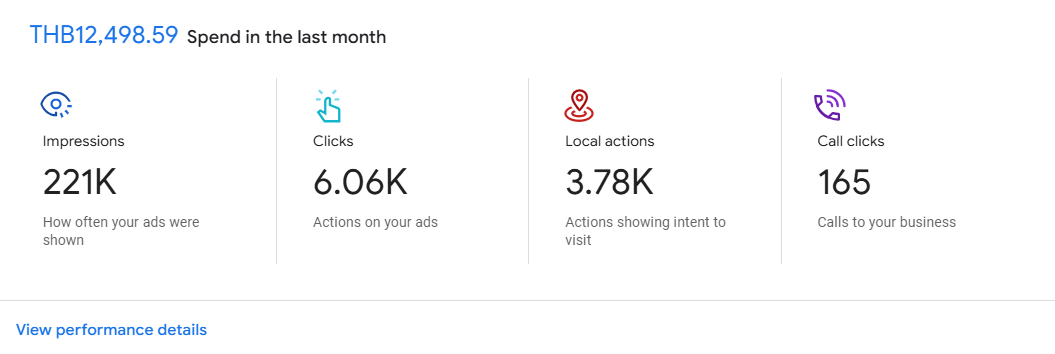
| Total Spend | ฿12,498.59 | Not provided |
| Impressions | 221K | Not provided |
| Clicks | 6.06K | Not provided |
| Local Actions | 3.78K | Not provided |
| Call Clicks | 165 | Not provided |
Visual Insights
Meta Ads Performance (Aggregate): Views and Reach show significant growth, driven by paid campaigns.
Meta Ads Campaign Breakdown: Local Reach ad outperformed reels in views and link clicks.
Google Ads Performance: Clicks and Local Actions increased, reflecting strong local intent.
Ads Performance Summary
Meta Ads Growth: Aggregate data shows 1.5M views (+100%) and 405.5K reach (+100%), with 179.6K post engagements (+100%). The campaign breakdown reveals 993,516 views, 333,748 reach, 443 link clicks, and ฿12,127.53 spent across three ads. The Local Reach ad (14 Feb) outperformed with 871.1K views and 298 link clicks, while the Boosted Reels (27 Feb and 25 Feb) had lower conversions (113 and 32 link clicks, respectively).
Discrepancy Note: The campaign breakdown totals (993,516 views, 333,748 reach) are lower than the aggregate (1.5M views, 405.5K reach), suggesting additional campaigns not shown in the screenshot or a data reporting issue—worth verifying.
Google Ads Performance: Spend of ฿12,498.59 generated 221K impressions, 6.06K clicks, 3.78K local actions, and 165 call clicks, showing strong local intent.
Cost Efficiency: Meta Ads cost per link click averages ฿12,127.53 / 443 = ~฿27.38, with the Local Reach ad being the most efficient (฿8,773.89 / 298 = ~฿29.44). Google Ads cost per click is ฿12,498.59 / 6,060 = ~฿2.06, significantly more cost-effective for driving clicks.
Synergy: Meta Ads excel in visibility (1.5M views), while Google Ads drive local conversions (3.78K local actions). The 443 Link Clicks from Meta and 81 Website Clicks from GMB align with the website’s 113 visitors, showing a cohesive funnel.
Conversion Gaps: Meta Ads’ link click rate (443 / 333,748 reach = ~0.13%) is low, indicating a need for stronger CTAs. Google Ads’ 165 call clicks align with GMB’s 35 calls, suggesting consistent call-to-action performance.
Ads Performance Action Steps
- Verify the discrepancy between Meta Ads aggregate (1.5M views) and campaign breakdown (993,516 views) to ensure accurate reporting.
- Shift Meta Ads budget toward Local Reach campaigns, as the 14 Feb ad delivered the best results (871.1K views, 298 link clicks).
- Improve Meta Ads Click-Through Rate (CTR) with stronger CTAs, targeting a higher link click rate than 0.13%.
- Use Meta’s Advantage+ Placements to optimize ad delivery, focusing on driving Link Clicks to the website.
- For Google Ads, use Performance Max campaigns to target high-intent audiences, capitalizing on the 3.78K local actions.
- Add negative keywords to Google Ads (e.g., “cheap pizza”) to reduce irrelevant clicks and maintain cost efficiency (~฿2.06 per click).
- Test video ads in both Meta and Google Ads to leverage Meta’s high viewership and Google’s high CTR.
🚀 Final Thoughts
ITALIANO Restaurant Rawai has made significant strides in digital performance:
- GMB: Strong local engagement with 798 interactions and 613 direction requests.
- Ads: Meta Ads delivered 1.5M views, while Google Ads drove 3.78K local actions, showing a balanced approach to visibility and conversions.
- Social Media: 980.2K views on Meta platforms, though organic reach needs improvement.
- Website: 113 visitors with a 42.1% engagement rate, indicating a solid user experience.
🔥 Next Steps:
- Continue optimizing GMB for local visibility and reviews.
- Scale Meta Ads for reach while focusing Google Ads on local conversions.
- Boost organic social media engagement to reduce ad dependency.
- Enhance website SEO and track reservation conversions.
🎯 With these strategies, ITALIANO Restaurant Rawai is well-positioned for continued growth in 2025! 🚀
2️⃣ Meta Social Media Insights (Facebook & Instagram)
Metrics
Visual Insights
Views and Engagement Trends: Views peaked early in March but declined toward the end of the month, with 99% driven by ads.
Performance Trends: Link Clicks and Profile Visits show steady activity, but follower growth is slow.
Meta Social Media Summary
Growth: Total Views grew by 21.0% to 980.2K, and Reach increased by 17.7% to 291.2K, showing continued expansion in visibility.
Engagement: Content Interactions rose modestly by 8.3% to 1.3K, indicating steady audience activity. However, engagement on top posts (e.g., 8 likes for 198 views) remains low, suggesting content isn’t resonating deeply.
Ad Dependency: 99% of views (980,163 total) came from ads, with only 1% organic. This heavy reliance on paid reach highlights a need to boost organic engagement.
Conversions: Link Clicks increased by 12.6% to 339, showing improved website traffic. However, Profile Visits dropped by 15.0% to 1.7K, possibly due to reduced organic reach or less compelling CTAs.
Follower Growth: New Follows grew by 15.8% to 22, but this remains low relative to the audience size, indicating a need for stronger follower acquisition strategies.
Content Performance: Top posts focus on Italian cuisine and dining experiences, but view-to-interaction ratios are low (e.g., 198 views to 8 likes). Posts like “Indulge in the taste of the sea” (101 views, 2 likes) underperform in engagement.
Meta Social Media Action Steps